The country has built one of the most precise poverty maps in the developing world. The real test is what it does with what it can see.
Nigeria is often accused of governing without data. On poverty, that charge no longer holds.
The 2022 National Multidimensional Poverty Index (MPI) changed the conversation. Built from data collected from roughly 56,000 households, it is among the most detailed poverty datasets produced by any low- or middle-income country. Rather than stopping at national or state averages, it identifies poverty at the level of all 109 senatorial districts, providing an unusually fine-grained picture of where deprivation is concentrated. It estimates that 133 million Nigerians, 63% of the population, are multidimensionally poor. Whatever else is uncertain about Nigeria's development trajectory, the location of its poverty is not.
Sceptics might ask whether this rests on the quirks of a single survey. It does not. When state-level living standards deprivations drawn from the housing module of the National Living Standards Survey (NLSS) are compared with the official MPI, the two closely track one another, with a correlation of 0.68. In practical terms, two independently collected datasets identify broadly the same states as experiencing the deepest deprivation. Taken together, the evidence points to the same underlying reality, suggesting that the geography of poverty reflects lived conditions rather than statistical noise.
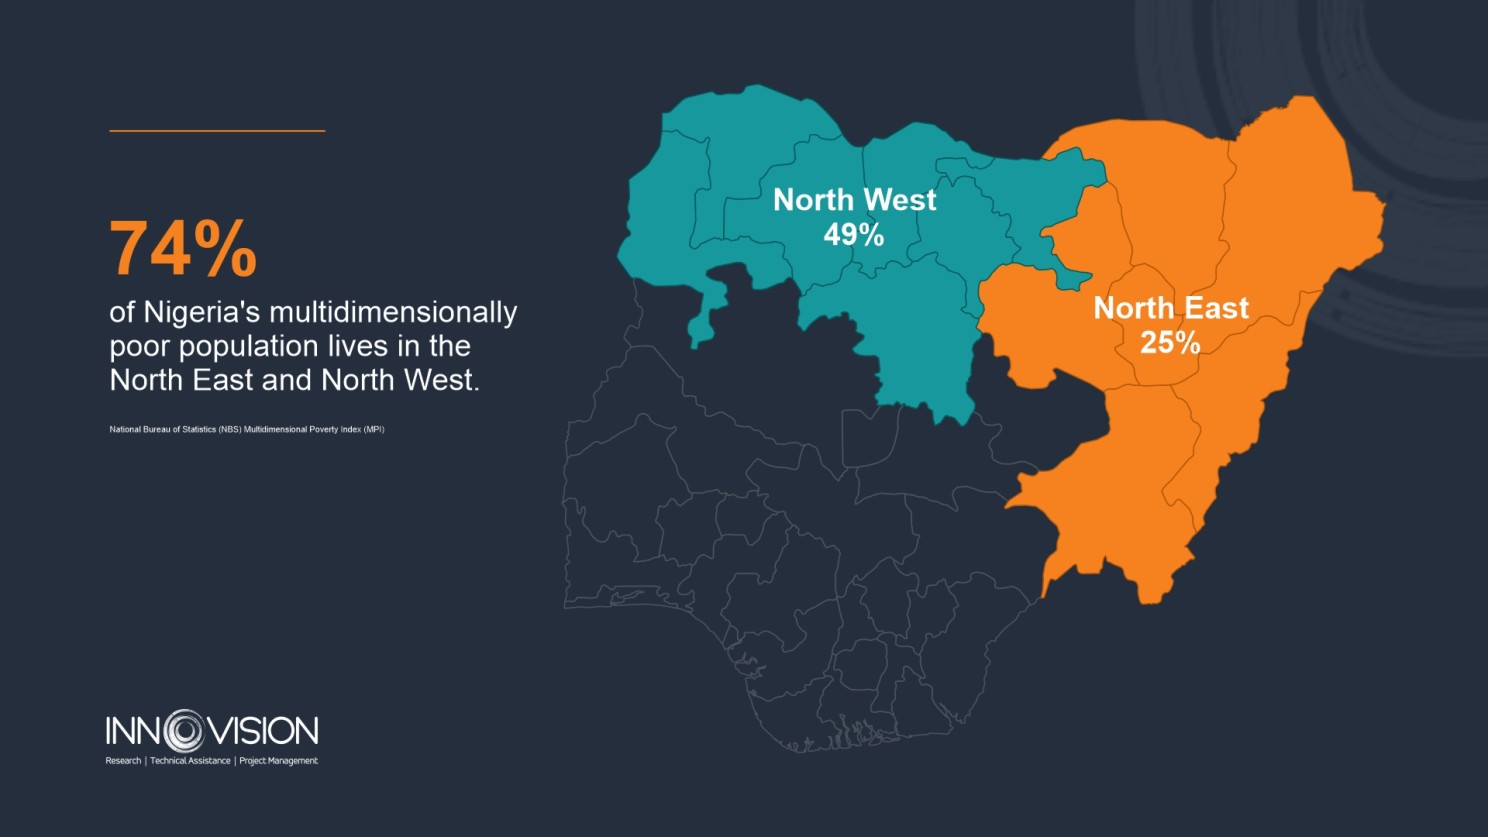
What that evidence reveals is unambiguous. Poverty in Nigeria is overwhelmingly concentrated in the North. Eight of the country's ten poorest states are located in the North East and North West, and together those two zones account for nearly three-quarters of all poor Nigerians. The North West alone represents 49%, while the North East accounts for a further 25%. This is not a marginal regional imbalance. It is the defining geography of poverty in Nigeria, and it has remained remarkably consistent across successive surveys.
The national headline, striking as it is, still understates the scale of deprivation. Saying that one in three Nigerians lives in severe poverty describes the country on average. It does not describe the states where the crisis is most acute. In thirteen states, more than half the population is severely poor, deprived across at least half of the indicators measured by the MPI. In those places, the reality is not one in three but one in two.
That distinction matters because a state where half the population faces severe multidimensional deprivation does not simply need modest income support. It requires comprehensive poverty-graduation strategies that combine immediate consumption support with productive assets, livelihoods, and pathways to long-term resilience.
The same geography reappears in the next generation. Nationally, 19.3% of children between the ages of six and fifteen are out of school. In several Northern states, that figure is two to three times higher, reaching 55.9% in Yobe. These are precisely the children social protection systems are meant to safeguard. Yet they remain among the hardest to reach because the country's flagship education-linked interventions depend on school attendance, which, for many, does not exist.
For much of the past decade, questions about Nigeria's poverty response often began with the availability of reliable data. Today, that is no longer the central constraint. The more pressing challenge is whether public programmes are using the evidence already available to reach the people who need them most.
Nigeria can now identify, with considerable precision, which states experience the deepest deprivation, how severe that deprivation is, and where the next generation is already being left behind. The challenge begins where that knowledge meets the institutions responsible for acting on it. The map is not the problem. What Nigeria does with it is.
This analysis draws on Registered but Unreached, Innovision Consulting Africa's state-level assessment of Nigeria's safety-net system. The report examines where implementation gaps are widest and what they reveal about the design and reach of Nigeria's social protection architecture.
Source: National Bureau of Statistics (NBS). & Oxford Poverty and Human Development Initiative (OPHI). (2022), Nigeria Multidimensional Poverty Index (MPI) Survey Report 2022, National Bureau of Statistics (NBS). (2020), Nigeria Living Standards Survey (NLSS) 2018/19, and National Bureau of Statistics (NBS). (2022). National Learning Poverty and Out-of-School Children Statistics.
Author: Obadiah Okpokpo & Micheal Idedia, MERL Team, Innovision Consulting Africa
.png)